📊 FOOTBALL BY NUMBERS: STATS & AI
PAGE 1 OF 5 · EXPECTED GOALS
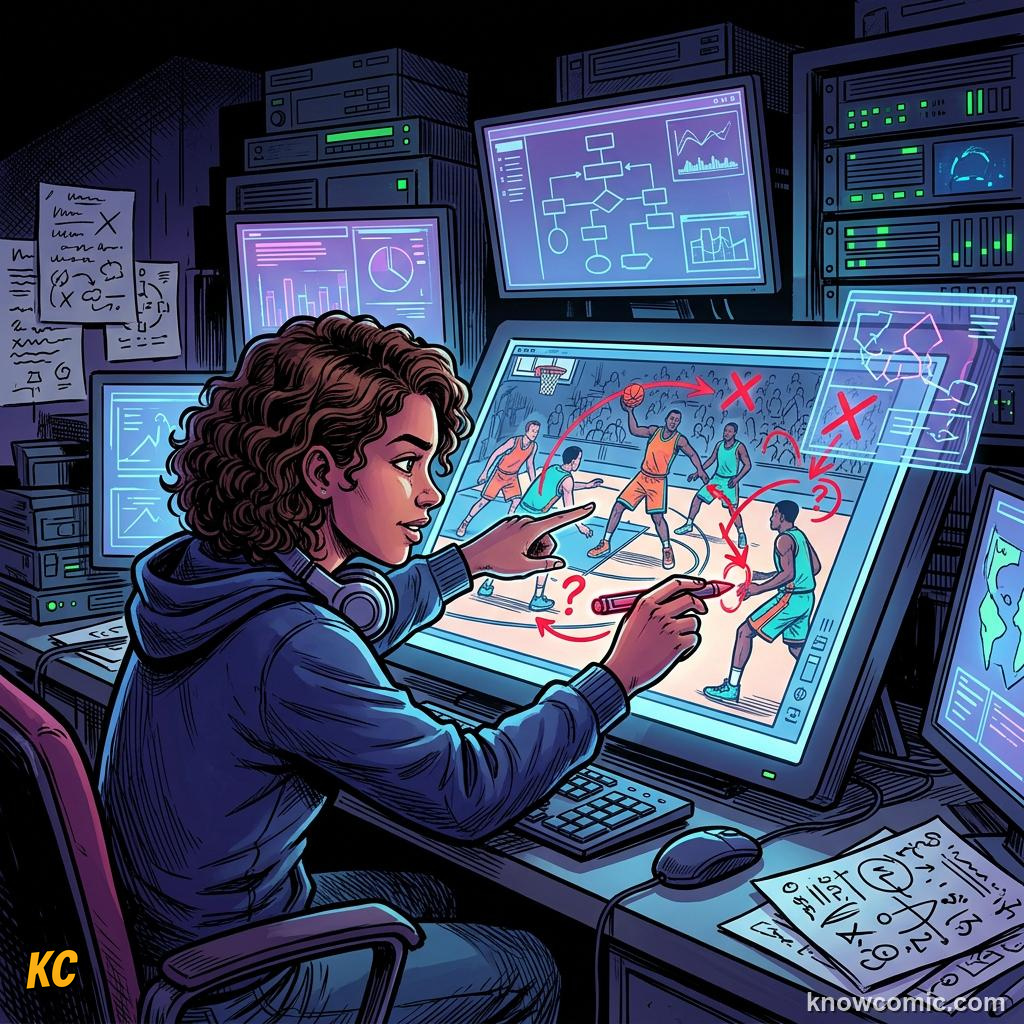
THE xG REVOLUTION
WHAT IS EXPECTED GOALS?
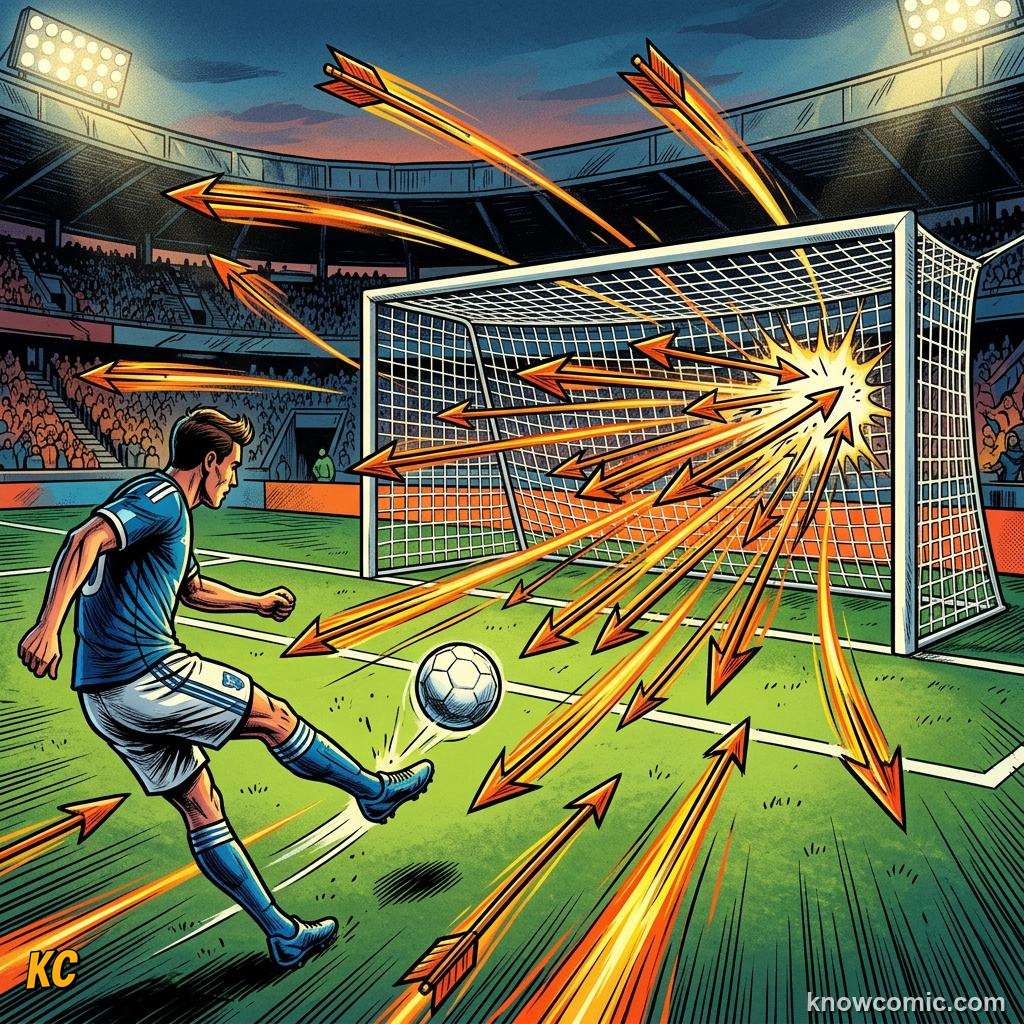
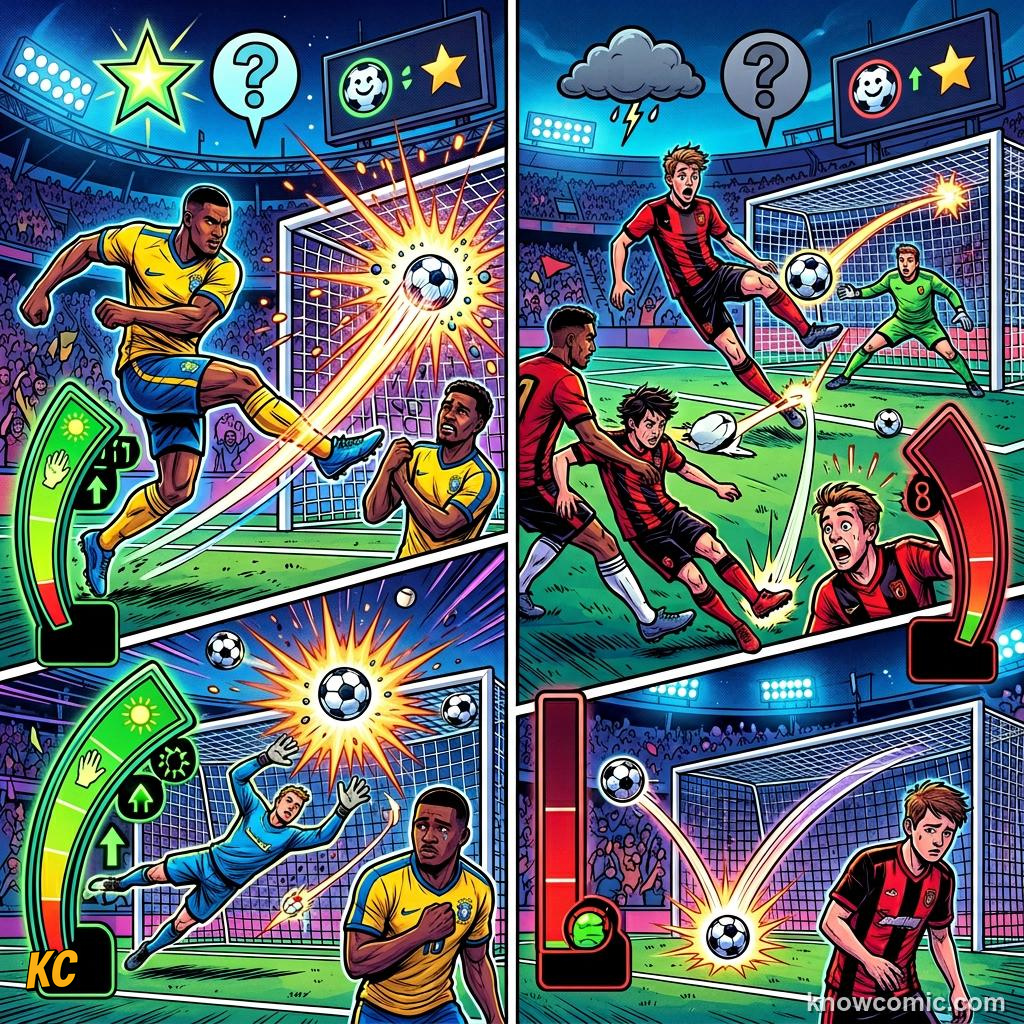
Expected goals, or xG, is a number that tells you how likely a shot was to go in. A tap-in from two yards might score 0.85 xG, meaning it goes in about 85 percent of the time. A wild shot from 35 yards might score 0.02 xG. Analysts built xG by studying thousands of past shots. They look at distance, angle, body part, pressure from defenders, and whether it was a header or volley. World Cup broadcasters now flash xG on screen during matches. Fans see a team dominate with 2.4 xG but lose 1-0 and understand the result was cruel, not fair. Coaches use xG to judge strikers who miss chances but keep getting into good spots. A forward with low goals but high xG is often unlucky, not bad. National teams employ data scientists who update xG models after every training game. The number does not replace the thrill of a goal, but it adds a layer of truth beneath the scoreline.
⚡ DID YOU KNOW?
A penalty kick is worth about 0.76 xG on average. That is why missing one feels so painful: the data says you should score most of the time.
xG!
DISTANCE
📏 Closer shots score higher xG
🎯 Angle to goal matters too
🎯 Angle to goal matters too
LUCK
🍀 High xG but no goals means bad luck
📺 TV shows live xG totals
📺 TV shows live xG totals
PAGE 2 OF 5 · HEAT MAPS
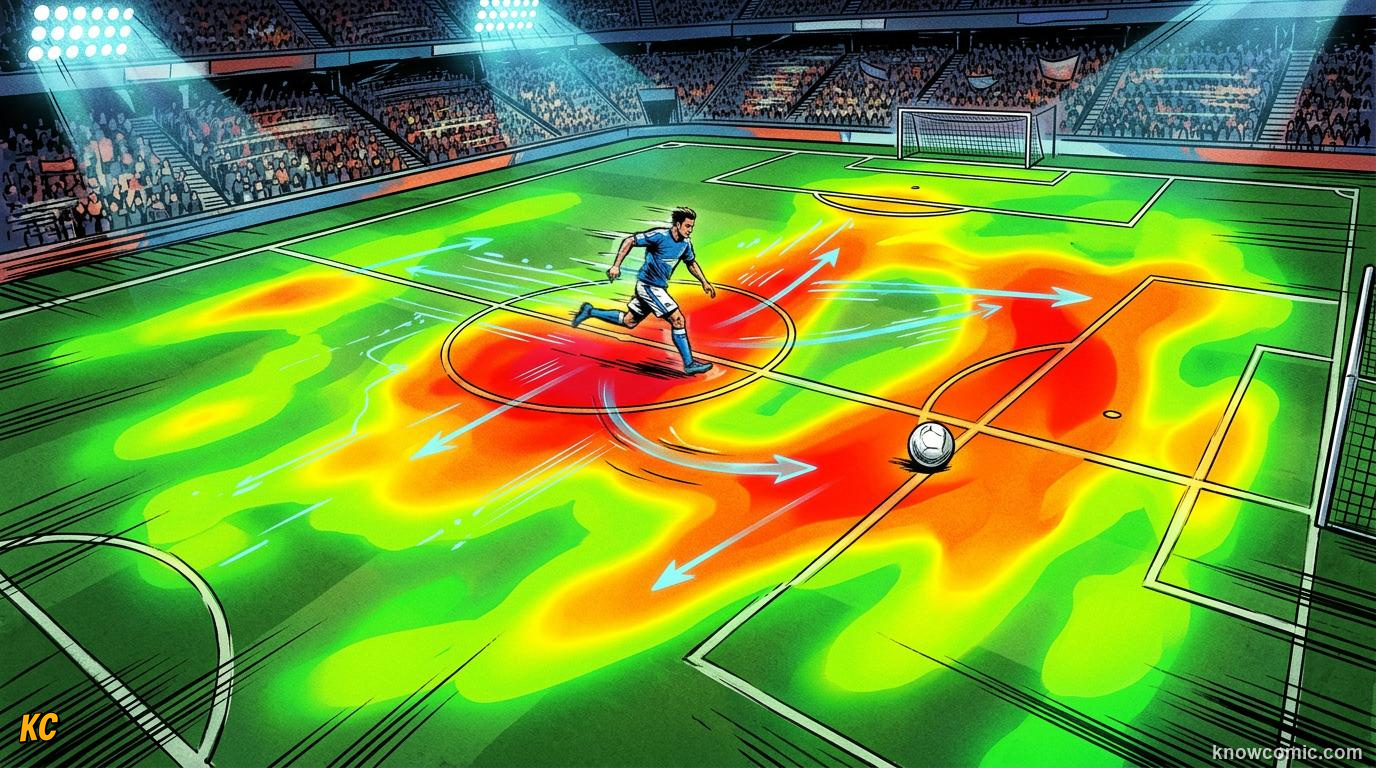
COLOUR ON THE PITCH
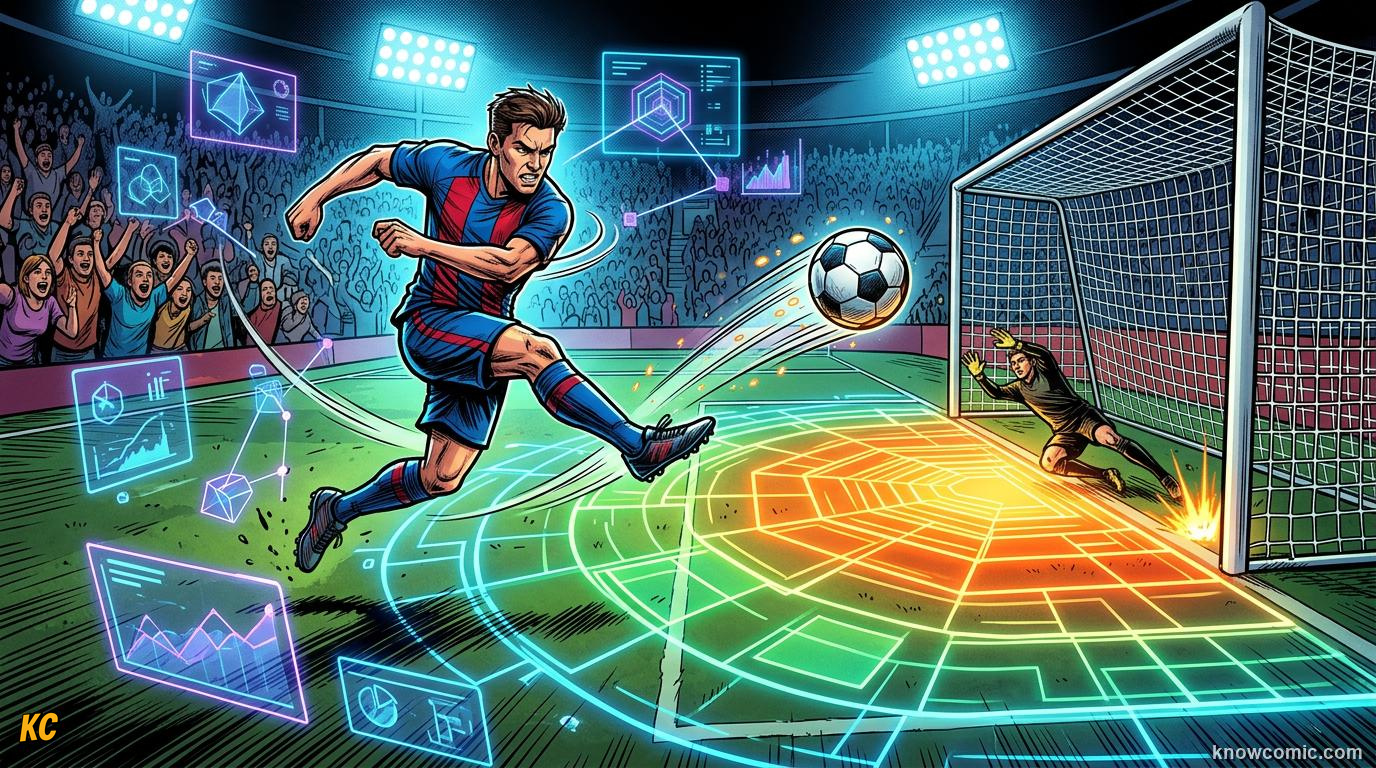
HEAT MAPS REVEAL THE GAME
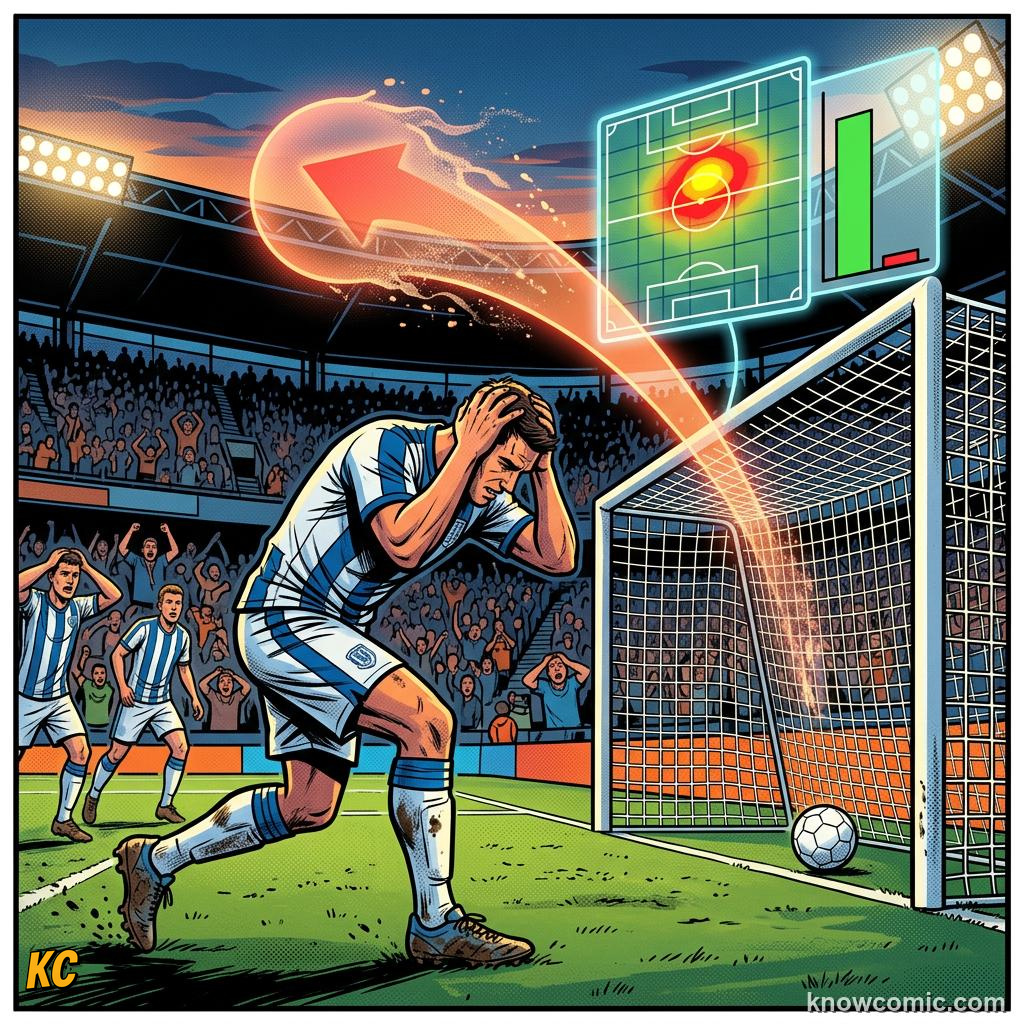
A heat map paints the pitch in colours showing where a player spent time. Red and orange mean lots of action. Blue and green mean quiet zones. Tracking cameras follow every player and build these maps automatically. A fullback's heat map might glow along the touchline where they overlap. A holding midfielder's map clusters in the centre circle. World Cup analysts compare heat maps before picking opponents. If a rival winger always drifts inside, the coach tells a fullback to tuck tighter. Heat maps also expose tired players. Late in a match, a striker's red zone might shrink toward the halfway line as legs fade. Teams share heat maps in video meetings with arrows and circles drawn on top. Kids can spot patterns too: the goalkeeper's map is tiny near the goal line, while a box-to-box midfielder covers half the field. Heat maps turn invisible running into visible proof of hard work.
⚡ HEAT MAP COLOURS
Most heat maps use a scale from cool blue (rare visits) to hot red (constant presence). One glance shows a player's true territory.
HEAT!
WINGER
🏃 Wide heat along the flank
✂️ Cuts inside show as diagonal trails
✂️ Cuts inside show as diagonal trails
MIDFIELD
🟠 Central blob in midfield
🔗 Links defence to attack
🔗 Links defence to attack
STRIKER
🔴 Hot zone in the penalty box
👻 Ghost striker stays high up
👻 Ghost striker stays high up
PAGE 3 OF 5 · PASS MAPS
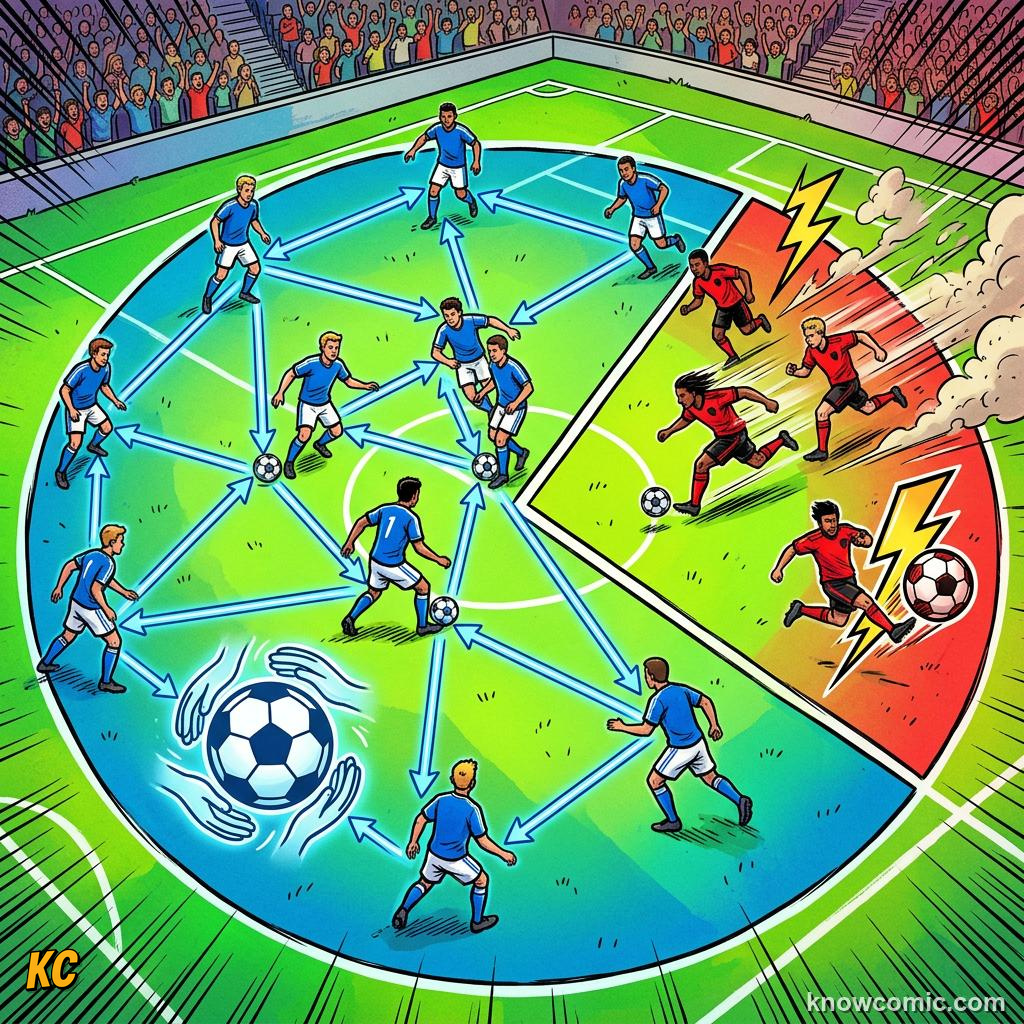
NETWORKS
🕸️ Lines show who passes to whom
📐 Thicker lines mean more passes
📐 Thicker lines mean more passes
KEY LINKS
⭐ Hub players sit at the centre
🚫 Break the hub, break the team
🚫 Break the hub, break the team
PASSING WEBS
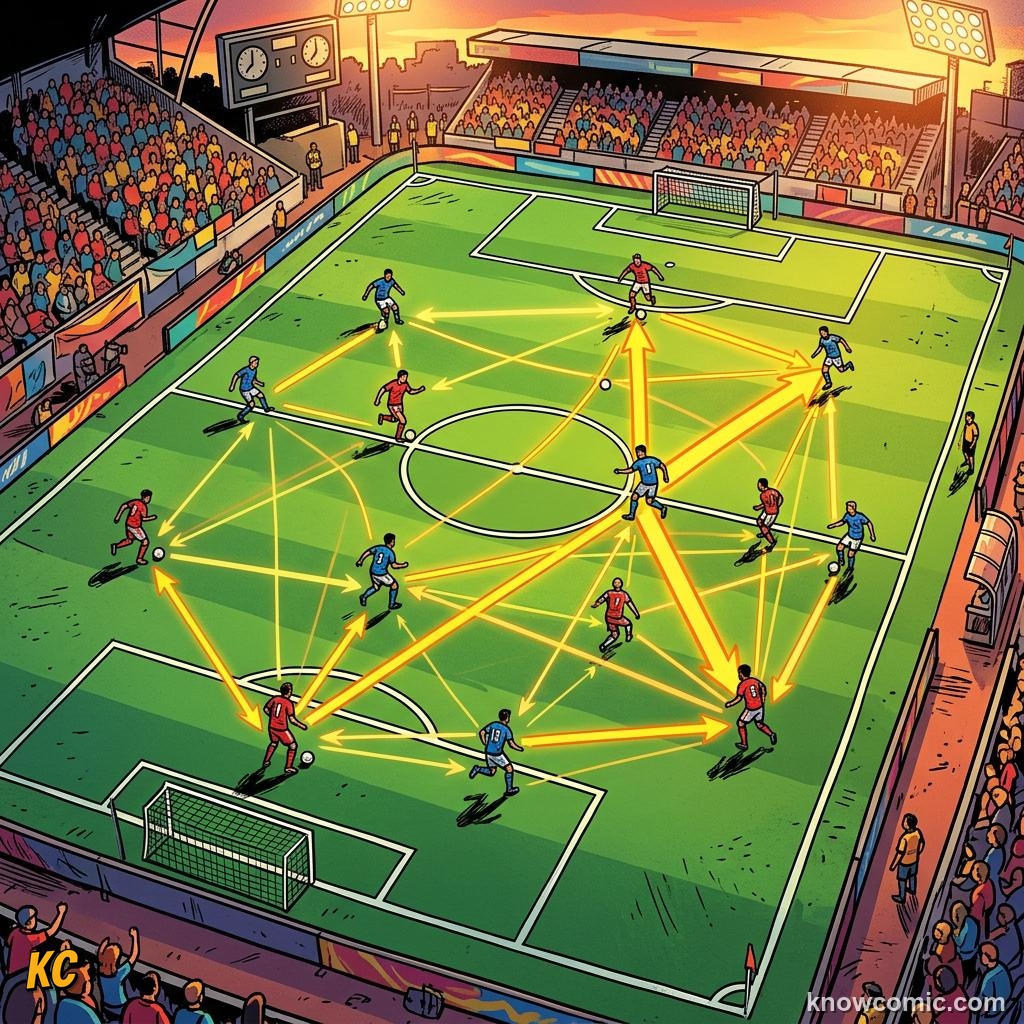
PASS MAPS TELL STORIES
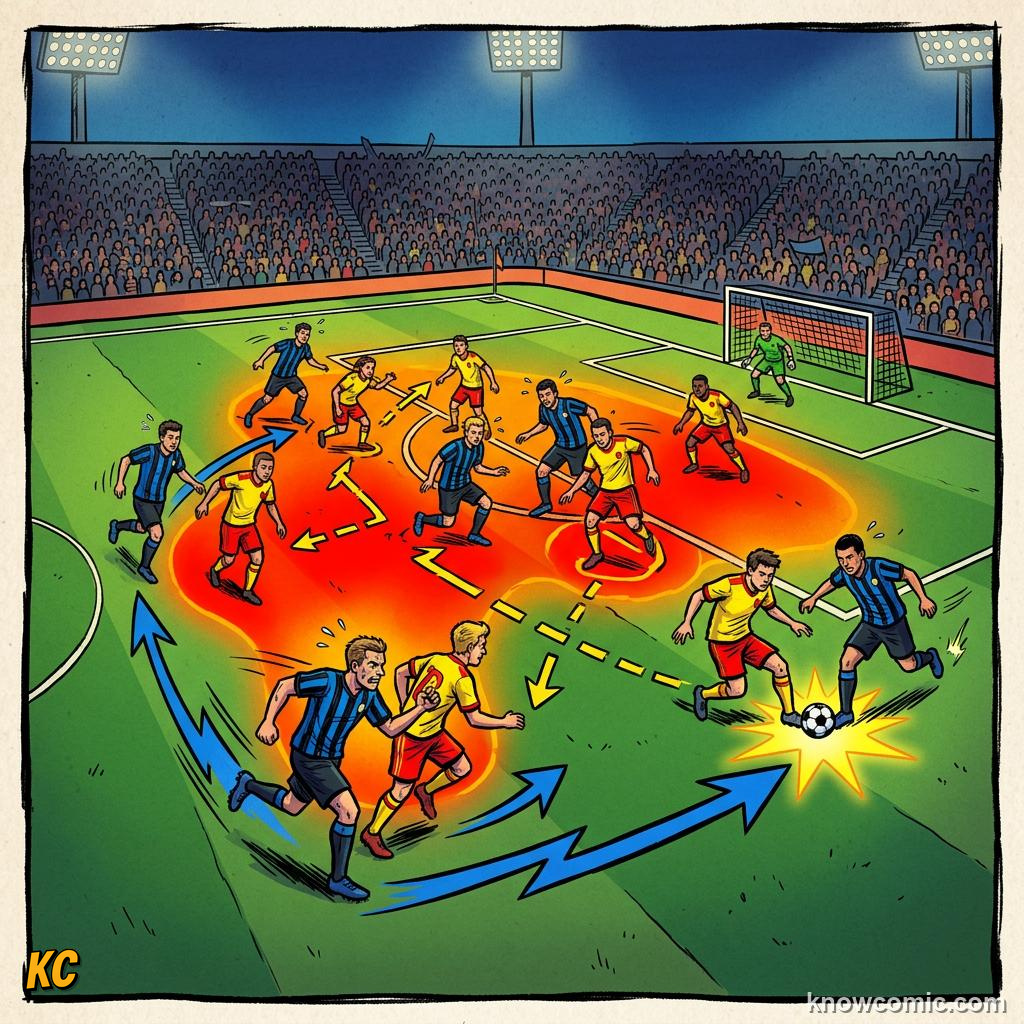
Pass maps draw arrows between players showing how the ball moved. A World Cup team's map might reveal a deep-lying playmaker feeding both wings in equal measure. Opponents study these webs to find weak links. If a centre-back only passes sideways and never forward, pressing that player can trap the ball in defence. Analysts also map pass direction: progressive passes move the team toward goal, while safe sideways passes keep possession. Spain-style teams show dense clusters in the final third. Counter-attacking teams show long arrows from defence to striker. Pass completion rate adds another stat: 95 percent sounds perfect until you notice every pass went backward. World Cup camps project pass maps on giant screens after friendlies. Players see their own arrows and learn where to improve. The playmaker with the thickest lines is often the heartbeat. Cut those lines and the rhythm dies.
⚡ PROGRESSIVE PASSES
A progressive pass moves the ball at least 10 metres closer to the opponent's goal. Midfielders who rank high here are true creators.
PASS!
PAGE 4 OF 5 · AI SCOUTING
MACHINES FIND STARS
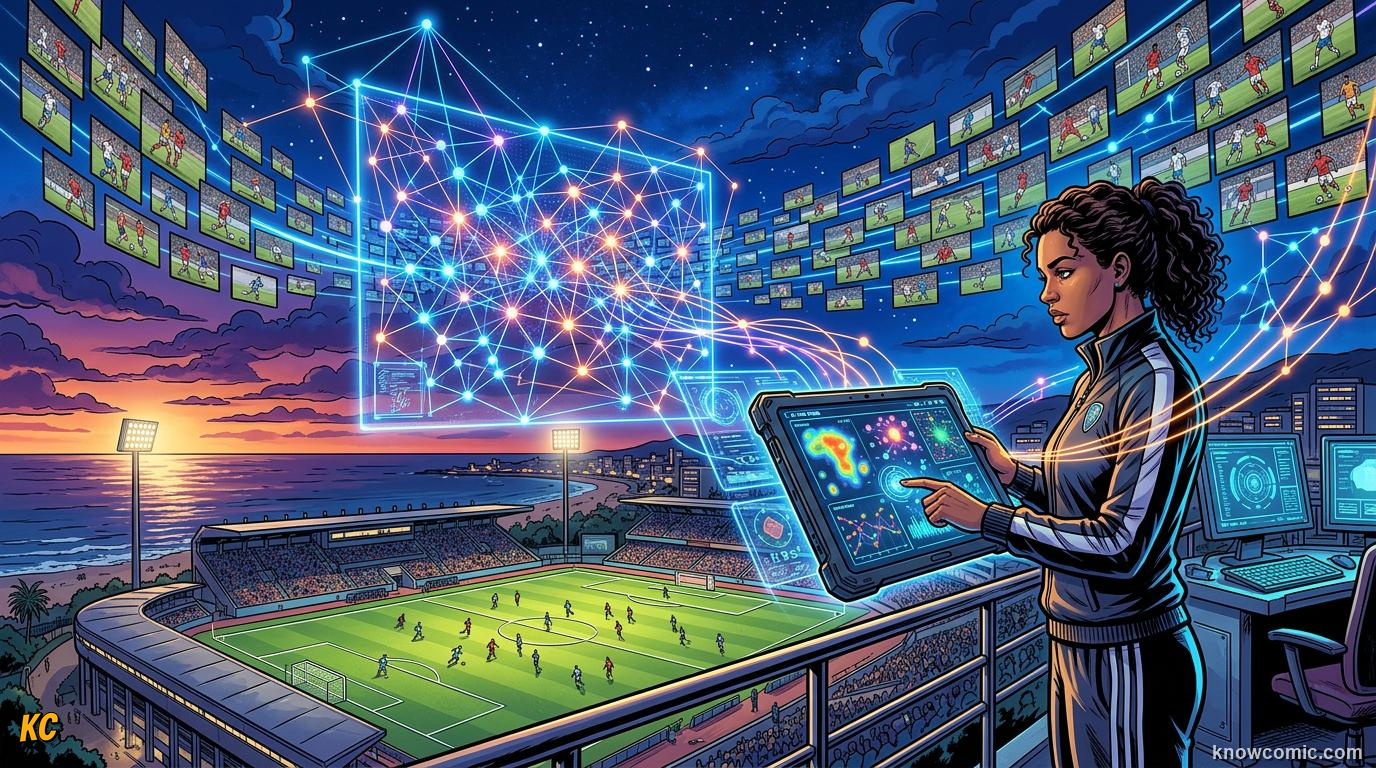
AI SCOUTING THE GLOBE
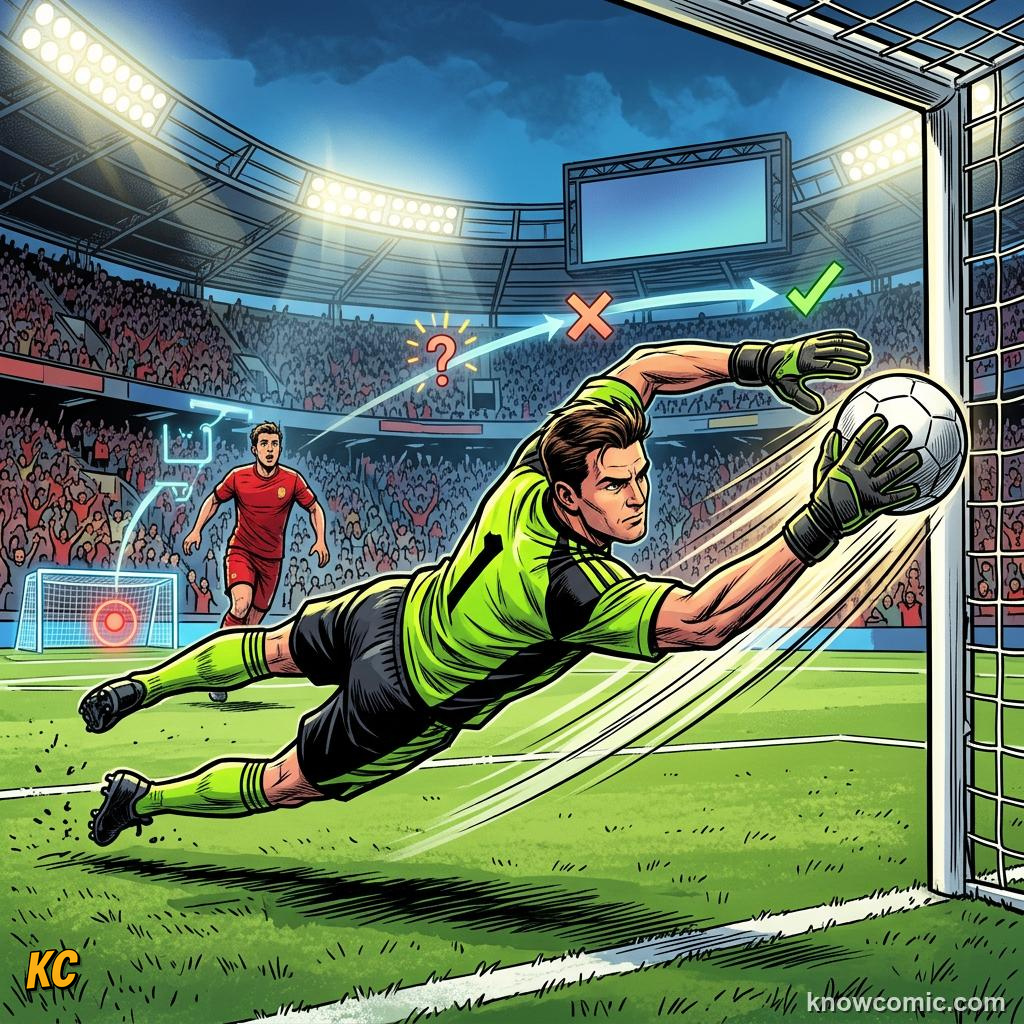
Artificial intelligence now watches football when human scouts sleep. Computer vision tracks players in leagues from Norway to Nigeria. Machine-learning models rate dribbles, tackles, and off-ball runs without bias toward famous clubs. A World Cup nation with a small scouting staff can use AI to shortlist hundreds of players overnight. The software flags a left-back in Colombia who wins duels at an elite rate or a striker in Japan whose xG per 90 minutes rivals top Europeans. Coaches still fly out to watch in person, but AI narrows the search from millions to dozens. Some tools predict how a teenager might develop by comparing their stats to past stars. Others spot tactical fit: this winger's sprint profile matches the system your manager runs. Privacy and fairness debates exist, but the tech keeps spreading. By World Cup 2026, even smaller nations access databases once reserved for giants. AI does not pick the final squad, but it opens doors that were locked before.
⚡ COMPUTER VISION
AI scouting uses cameras and algorithms to track every touch in a match automatically. No manual notes needed for basic event data.
AI!
SEARCH
🌍 Scans leagues worldwide
🔎 Filters by age, position, stats
🔎 Filters by age, position, stats
COMPARE
📊 Matches players to past pros
🧬 Predicts development curves
🧬 Predicts development curves
FIT
⚙️ Checks tactical compatibility
👥 Human scouts confirm the shortlist
👥 Human scouts confirm the shortlist
PAGE 5 OF 5 · ANALYTICS DASHBOARDS
COACH'S SCREEN
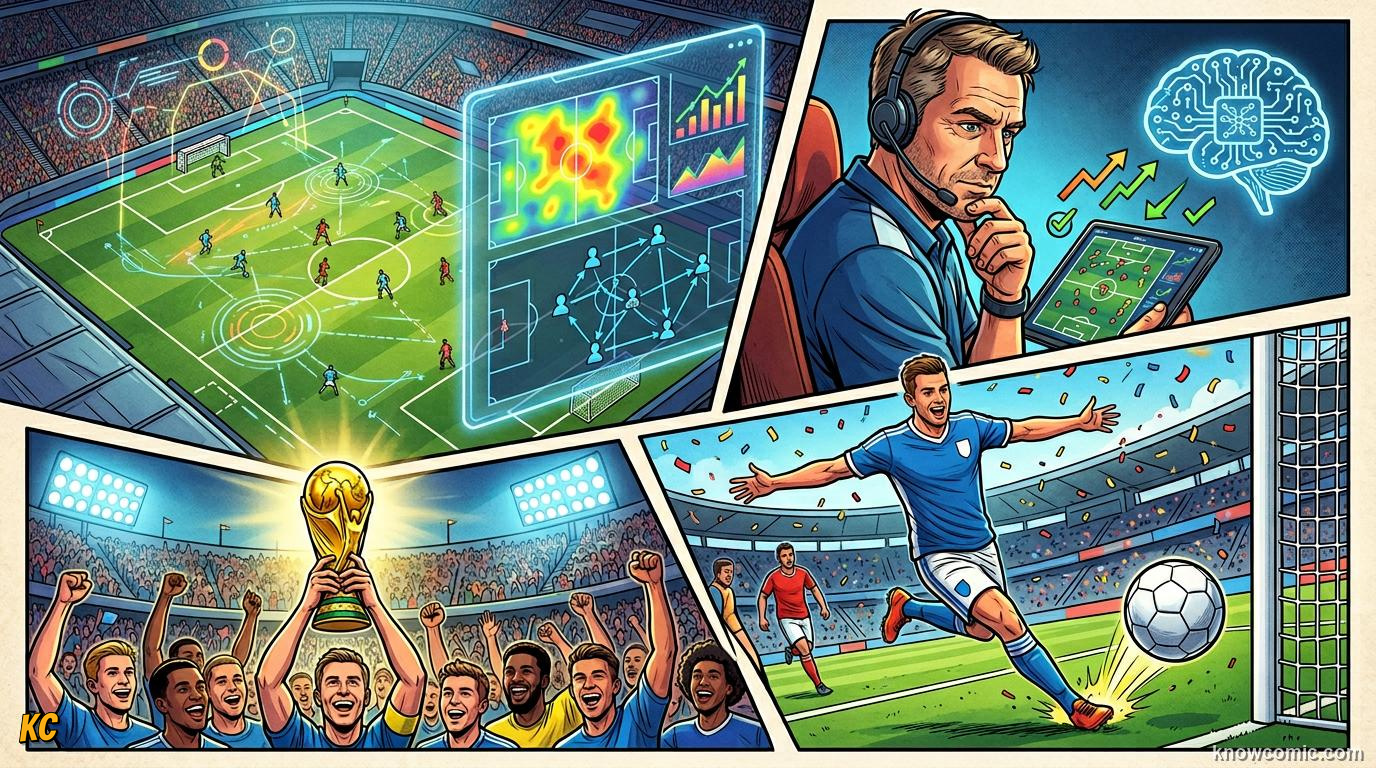
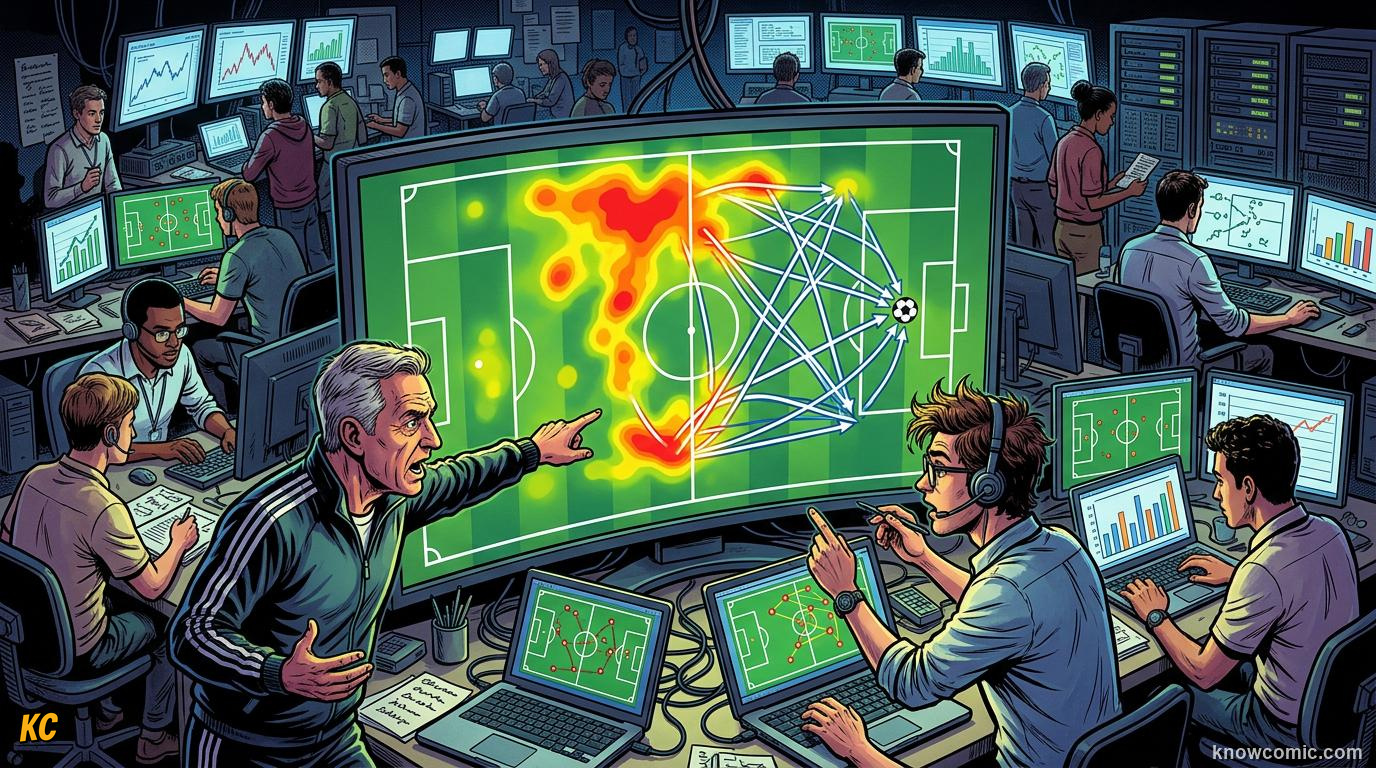
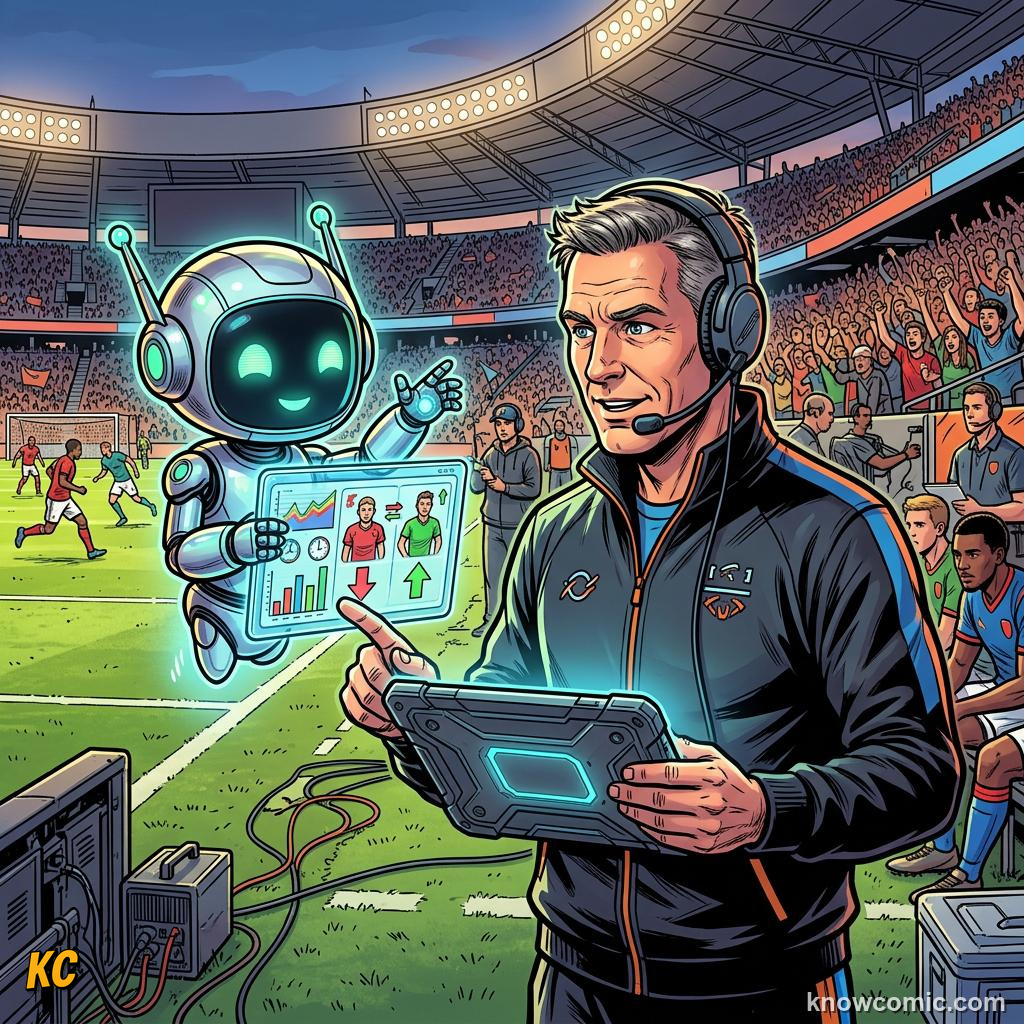
DASHBOARDS DRIVE DECISIONS
On a World Cup bench sits a tablet packed with live analytics. Dashboards combine xG, heat maps, pass maps, and fitness data in one view. Analysts in the stands radio insights to the coach: their right winger has been isolated three times, or the opponent's press succeeds only on the left. Halftime meetings pull up dashboards on a big screen. Substitutions become data-informed. Bring on a fresh presser because the other team's pass map shows fatigue in midfield. Rest your striker because sprint counts dropped 20 percent. World Cup 2026 squads travel with entire analytics departments. Players receive personalised reports after each match. Fans access simplified versions on apps. The beautiful game now has a beautiful spreadsheet behind it. Numbers never dribble past a defender, but they help coaches ask the right questions. The manager who ignores data risks falling behind. The one who blends gut feeling with dashboards has the modern edge.
⚡ LIVE DASHBOARDS
World Cup analysts can update stats within seconds of an event. Coaches sometimes change shape at halftime based on what the numbers reveal.
DATA!
TABLET

📱 Real-time stats on the touchline
🎧 Analysts feed info to the coach
🎧 Analysts feed info to the coach
REMEMBER
📊 KEY FACTS
xG measures shot quality. Heat maps show where players run. Pass maps reveal team connections. AI scouts search the world for talent. Dashboards help coaches pick tactics and subs at the World Cup.
🎯 xG tells the true story of chances
🤖 AI finds players humans might miss
💻 Data and football now go together
🤖 AI finds players humans might miss
💻 Data and football now go together
🧠 QUIZ TIME!
FOOTBALL BY NUMBERS: STATS & AI · 5 QUESTIONS
QUESTION 01
What does xG (expected goals) measure?
QUESTION 02
What do heat maps show on a football pitch?
QUESTION 03
What do pass maps reveal about a team?
QUESTION 04
How does AI help with football scouting?
QUESTION 05
Why do World Cup coaches use analytics dashboards?
0/5
LOADING...